Become a Data Scientist in just 6 months

No coding experience required
Risk free investment on your future
6 months interactive live classes

 500% Salary Hike

 400% Salary Hike

 250% Salary Hike
 200% Salary Hike
 300% Salary Hike

 500% Salary Hike
 400% Salary Hike
 250% Salary Hike
 200% Salary Hike
 300% Salary Hike
Key Highlights
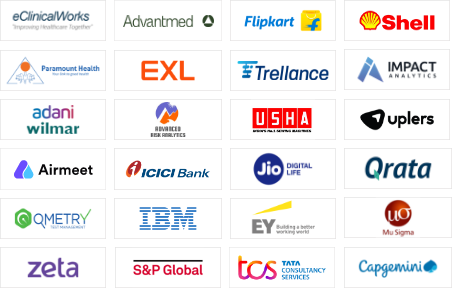
Learners Who Transitioned Successfully

Fingertips transformed my understanding of Business Analysis. From a basic knowledge level, their courses equipped me with advanced skills and practical applications of powerful tools. Grateful to Fingertips for empowering my professional growth.

Exciting news! All thanks to Fingertips, I'm thrilled to announce my new role as a Machine Learning Engineer at # Paramount Health Services and Insurance TPA Ltd. Pvt. A big shoutout to my mentor and Fingertips for their invaluable support.

Happy to share that I recently joined Advantmed India LLP as a Business Intelligence Lead. Thanks to Fingertips, I've secured a remarkable role. I am grateful to my mentor and the incredible team at #Fingertips for their unwavering support throughout my journey. I am thrilled to embark on this new chapter and make a meaningful impact in BI.

I am very excited to start this new chapter of my career—special thanks to my mentors and Fingertips, one of the best data science learning platforms. Grateful for the knowledge and skills gained, I'm ready to conquer new heights in the world of data science.

Fingertips played a significant role in my career transition. The personalized mentorship has been instrumental in my growth Fingertips empowers students to excel in data science. Highly recommended for those seeking a transformative learning journey.
Let’s Begin Your Exciting Journey at Fingertips
- Basics of Statistics
- Advanced Statistics
- Probability with Problem-Solving
- Linear Algebraic Equations
- Calculus
- Linear Regression & Outlier Detection
- Optimization And Its Techniques
- Stochastic Search
- Overview Of Advanced MS Excel
- Data Formatting In Excel
- Basic And Advanced Data Sorting
- Conditional Formatting
- Advanced Functions In Excel
- Advanced-Data Validation
- Lookup And Reference Functions
- Index Match In Excel
- Data Security in Excel
- Data Analysis With Pivot Table
- Sorting, Filtering, And Grouping Data With Pivot Tables
- Enriching Data Table Calculated Values & Fields
- Charts And Graphs In Excel
- Visually Effective Excel Dashboards
- Excel Macros
- Excel VBA
- Making Data Table In Excel
- How to Create a Date Table to Get Multiple Results
- Scenario Manager
- Introduction To Programming & Python
- Datatypes
- Operators
- Expressions
- Conditionals
- Loops
- Functions
- Recursion
- OOPS Concepts
- Data Structures
- Error Handling
- Scikit-Learn Library
- NumPy For Mathematical Computing
- Data Visualization With Matplotlib And Seaborn
- Data Manipulation With Pandas
- Exploratory Data Analysis
- Introduction To Machine Learning
- Feature Selection
- Feature Scaling
- Principal Component Analysis (PCA)
- Discriminant Functions
- Linear Discriminant Analysis (LDA)
- Exploratory Factor Analysis (EFA)
- Introduction To Supervised Learning
- Linear Regression
- Logistics Regression
- Classification And Regression Trees
- Decision Trees And Random Forest
- Support Vector Machines (SVM)
- K-Nearest Neighbor And Support Vector Machine
- Bootstrapping And Boosting
- Introduction To Unsupervised Learning
- Spherical K-Means And Incremental Clustering
- K-Means Clustering
- Hierarchical Agglomerative Clustering And DBSCAN
- Mean-Shift Clustering
- PLSA & Sequence Mining
- Association Mining Rule
- Hidden Markov Model (HMM)
- Introduction To DATABASE
- Introduction To SQL
- SQL Operators With Syntax
- Working With SQL: Join, Tables, & Variables
- Writing Subqueries In SQL
- SQL Views, Functions & Stored Procedures
- Advance SQL Operations
- Introduction To Power BI
- Power BI Dekstop
- Data Transformation
- Data Modeling
- Data Analysis Expressions (Dax)
- Data Visualization
- Power BI Dashboard
- Power BI Service
- Working With Dashboards
- Direct Connectivity In Power BI
- Advanced Analytics In Power BI
- Introduction to Tableau
- Connecting different sources
- Working with Metadata
- Join Data
- Data-Blending
- Filters
- Charts and Graph
- Advance Charts
- Level of Detail Expression
- Working with Dashboards In Tableau
Module 1: APPLIED BUSINESS STATISTICS WITH EXCEL
Power Packed With The Assistance of ChatGPT
- Basics of Statistics
- Advanced Statistics
- Probability with Problem-Solving
- Linear Algebraic Equations
- Calculus
- Linear Regression & Outlier Detection
- Optimization And Its Techniques
- Stochastic Search
- Overview Of Advanced MS Excel
- Data Formatting In Excel
- Basic And Advanced Data Sorting
- Conditional Formatting
- Advanced Functions In Excel
- Advanced-Data Validation
- Lookup And Reference Functions
- Index Match In Excel
- Data Security in Excel
- Data Analysis With Pivot Table
- Sorting, Filtering, And Grouping Data With Pivot Tables
- Enriching Data Table Calculated Values & Fields
- Charts And Graphs In Excel
- Visually Effective Excel Dashboards
- Excel Macros
- Excel VBA
- Making Data Table In Excel
- How to Create a Date Table to Get Multiple Results
- Scenario Manager
Module 2 : PYTHON PROGRAMMING
Power Packed With Data Analysis on Several Projects
- Introduction To Programming & Python
- Datatypes
- Operators
- Expressions
- Conditionals
- Loops
- Functions
- Recursion
- OOPS Concepts
- Data Structures
- Error Handling
- Scikit-Learn Library
- NumPy For Mathematical Computing
- Data Visualization With Matplotlib And Seaborn
- Data Manipulation With Pandas
- Exploratory Data Analysis
Module 3 : MACHINE LEARNING
Power Packed With AI Automating AI
- Introduction To Machine Learning
- Feature Selection
- Feature Scaling
- Principal Component Analysis (PCA)
- Discriminant Functions
- Linear Discriminant Analysis (LDA)
- Exploratory Factor Analysis (EFA)
- Introduction To Supervised Learning
- Linear Regression
- Logistics Regression
- Classification And Regression Trees
- Decision Trees And Random Forest
- Support Vector Machines (SVM)
- K-Nearest Neighbor And Support Vector Machine
- Bootstrapping And Boosting
- Introduction To Unsupervised Learning
- Spherical K-Means And Incremental Clustering
- K-Means Clustering
- Hierarchical Agglomerative Clustering And DBSCAN
- Mean-Shift Clustering
- PLSA & Sequence Mining
- Association Mining Rule
- Hidden Markov Model (HMM)
Module 4: RELATIONAL DATABASES
Power Packed With ChatGPT To Make SQL Queries Easy
- Introduction To DATABASE
- Introduction To SQL
- SQL Operators With Syntax
- Working With SQL: Join, Tables, & Variables
- Writing Subqueries In SQL
- SQL Views, Functions & Stored Procedures
- Advance SQL Operations
Module 5: DATA VISUALIZATION USING POWER BI AND TABLEAU
Power Packed With Visualization Using ChatGPT
- Introduction To Power BI
- Power BI Dekstop
- Data Transformation
- Data Modeling
- Data Analysis Expressions (Dax)
- Data Visualization
- Power BI Dashboard
- Power BI Service
- Working With Dashboards
- Direct Connectivity In Power BI
- R And Python In Power BI
- Advanced Analytics In Power BI
- Introduction to Tableau
- Connecting different sources
- Working with Metadata
- Join Data
- Data-Blending
- Filters
- Charts and Graph
- Advance Charts
- Level of Detail Expression
- Working with Dashboards In Tableau
Predicting YouTube Trending Videos
Youtube wants to create a list of the most trending videos on its platform. Build a system that measures the influence of various factors like total shares, views, comments, likes, etc to create a list of trending videos.
Tools & Techniques Covered
Word CloudTableauModel FittingModel Identification
Netflix Movie Recommendation Analysis
The project aims to comprehend Netflix's movie recommendation system by applying data manipulation concepts such as data loading, viewing, cleaning, slicing, and mapping. These techniques will provide insights into the workings of the movie recommendation algorithm.
Tools & Techniques Covered
Feature SelectionHeat MapFeaturingExploratory Technique
Analysis Of Top Tracks On Spotify
Which are the most popular songs? Which genres were most popular this year? Which artists were most popular? Here you will find it all! This project on the analysis of top tracks on Spotify will help you to analyze the popularity of top tracks.
Tools & Techniques Covered
Data ExplorationCorrelationFeature ImportanceDensity Plot
Analysis of Best-Selling Novels 2009-2021
Explore the fascinating world of Amazon's best-selling novels using a dataset encompassing diverse book categories. Analyzing key factors such as publishing year, user rating, reviews, price, and genre, we unveil the secrets behind determining the coveted Amazon Best Selling Novel based on sales data.
Tools & Techniques Covered
Sentiment Analysis Statistical Modeling Hypothesis Testing
Airbnb New User Prediction
In this exciting project, you will learn to predict the location of a booking by a user for the first time. The accurate prediction will help to reduce the average booking time. Data such as browser history and the location of a user are used in the project.
Tools & Techniques Covered
Feature ScalingLogistic RegressionRandom ForestInferential Statistics
Walmart's Retail Sales Analysis
Here, you will be dealing with Walmart’s sales dataset and follow all the data analysis steps. The business problem in the project is to acquire insight into how various factors can influence Walmart’s Retail Sales. we will analyze the effects of temperature, store size, fuel prices, and other such factors on Walmart's Retail sales.
Tools & Techniques Covered
Data PreprocessingMissing Values HandlingModel AssessmentOutliers
Bike Sharing Demand Prediction
Experience the art of predicting Bike Sharing demand through efficient pre-processing techniques. Delve into the world of Bike-sharing systems, where vast datasets encompass travel duration, departure, arrival locations, and more. Our project focuses on leveraging historic data to forecast bike demand with precision.
Tools & Techniques Covered
Linear RegressionHistogramK-Nearest Neighbors AlgorithmDecision Tree
Zomato complete EDA
This Project will help you get What kind of food is more popular in a locality and check whether the entire locality loves vegetarian food. This kind of analysis can be done using the data, by studying the factors such as the location of the restaurant approx., price of food, and the locality.
Tools & Techniques Covered
Power BIBox Plot Sentimental AnalysisFeature Encoding
- The 7 Cs of Effective Business Communication
- Communication English
- Grammar Mastery: Tenses, Adjectives, and Verbs
- Body Language & Modals
- Ace Your Business Presentations
- Effective Email Writing
- Telephonic Communication and Business Vocab
- Networking and Interpersonal Skills Development
- Resume Building
- LinkedIn Profile Creation
- Profile Building
- Interview Best Practice
- Technical interview
- 10+ Mock Analytic Interviews
- HR interview
- 10+ Mock Commination Interviews
- Company-Specific Interview Guides
- Several Coding Challanges
- Industry Specific Projects on Python, Machine Learning, and data Analytics
- Work on Real World Datasets
- 50+ Assignments

Who can apply for this course?
Students who are in the final year of graduation or post-graduation.
Recent Graduates who want to pursue a career in the field of Data Science.
Professionals Who are looking at building a career in Data Science.
Who can apply for this course?
Students who are in the final year of graduation or post-graduation.
Recent Graduates who want to pursue a career in the field of Data Science.
Professionals Who are looking at building a career in Data Science.
Get Certified with Fingertips
Certificate
Upon completing this program, you will be granted a certificate of completion from Fingertips.
Credible
It validates the expertise of over 15,000 learners in the field, boosting your credibility and giving a competitive edge in the job market, and opening doors to lucrative career opportunities.
Shareable
Leverage the power of your certificate by showcasing it on LinkedIn and job hosting platforms, unlocking exciting recruitment prospects with renowned companies.