50+ Statistics Job Interview Questions And Answers

Introduction
Are you looking to build a career in data science? You must
know that statistics and probability hold immense value and plays important
role in the journey of a data science career path. Statistics have a huge
impact on the computing and data-handling fields worldwide.
Many successful companies are investing in statistics and
analysis, which helps to expand their business insights. This eventually has
created many job requirements in the data science sector. This article will
revise your statistics and probability aspects and help you prepare for the
statistics questions for the interview.
We have come up with questions regarding the statistics interview that will guide you on how to crack the interview effectively and confidently.
Basic Statistics Interview Questions
1. What is the difference between descriptive and inferential statistics?
Descriptive statistics is used to describe and summarize data, while inferential statistics is used to make predictions and inferences about a population based on a sample.
2. What is the difference between population and sample in statistics?
The difference between population and sample is that a population includes all members of a group, while a sample is a smaller group selected from the population.
3. What are different types of categorical variables, explain with examples?
There are two main types of categorical variables:
Nominal variables: Nominal variables are variables that have no order or ranking.
Example: Marital status (single, married, divorced)
Ordinal variables: Ordinal variables are variables that have an order or ranking.
Example: Educational level (high school, bachelor's degree, master's degree, Ph.D.)
In addition to nominal and ordinal variables, there is another type of categorical variable called binary variables, which have only two categories.
Binary variables can be either nominal (e.g., male/female) or ordinal (e.g., pass/fail).
4. What is the difference between analytics and analysis?
Analysis is the process of examining and evaluating data, while analytics is the use of data and statistical techniques to extract insights and inform decision-making.
5. What are the different types of analysis?
Qualitative analysis: Qualitative analysis involves examining and interpreting non-numerical data, such as words, images, and observations. It involves the use of techniques such as content analysis and thematic analysis.
Quantitative analysis: Quantitative analysis involves examining and interpreting numerical data. It involves the use of statistical techniques to identify patterns and relationships in the data.
6. Explain the difference between mean, median, and mode?
The mean is the average of a set of values, calculated by adding all the values together and dividing by the number of values.
The median is the middle value in a set of values, when the values are ordered from smallest to largest.
The mode is the most frequently occurring value in a set of values.
In what case, the median is a better measure than mean.
When we have skewed data that can be positively or negatively skewed, the median is preferred as it provides an accurate measure.
7. How do you calculate standard deviation?
First we need to calculate the mean of the values. Then, for each value, we subtract the mean and square the result. Then sum all of these squared differences and divide the result by the number of values. Finally, we take the square root of this result to get the standard deviation.
8. What is the relationship between standard deviation and variance?
The standard deviation is a measure of the spread or dispersion of a set of data, while the variance is the average of the squared differences from the mean.
variance = standard deviation^2
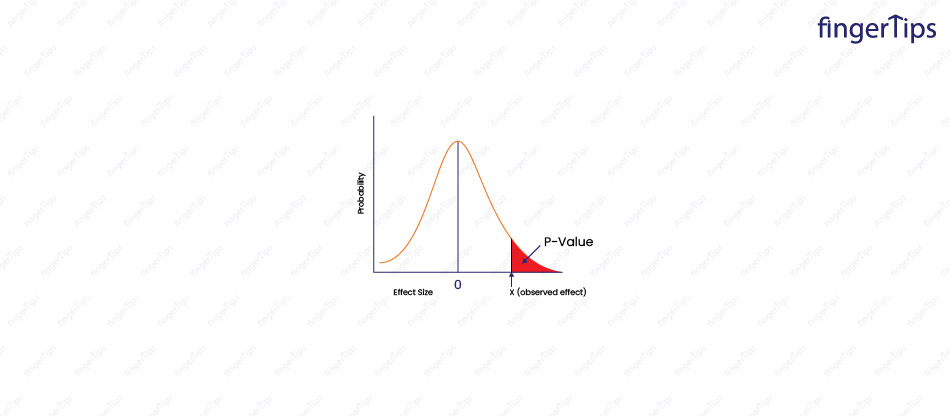
9. What is a 'p-value'?
A p-value is a statistical measure used to assess the likelihood of a hypothesis being true. It is used in hypothesis testing to determine whether the results of a study are statistically significant.
10. What is the Law of Large Numbers?
The law of large numbers states that, as the sample size increases, the sample will become more representative of the population and the sampling error will decrease. This means that the estimates based on the sample will be more accurate and reliable.
11. What is the assumption of normality?
It is also known as the normal distribution assumption which states that a variable follows a normal distribution that is a bell-shaped curve, symmetrical around the mean, with most of the observations concentrated in the middle and fewer observations as we move further from the mean.
12. What are real-world examples of symmetric distribution?
Here are a few examples of symmetric distribution:
The heights of adult men
The number of heads that come up when a coin is flipped 10 times
13. What is skewness?
Skewness is a measure of the symmetry of a distribution. A distribution is symmetric if it is centered around its mean and the data is evenly distributed on either side of the mean.
14. What are left-skewed and right-skewed distributions?
A left-skewed (or negatively-skewed) distribution is one where the data is skewed to the left, meaning that there is a long tail on the left side of the distribution and the mean is less than the mode (the most common value).
A right-skewed (or positively-skewed) distribution is one where the data is skewed to the right, meaning that there is a long tail on the right side of the distribution and the mean is greater than the mode.
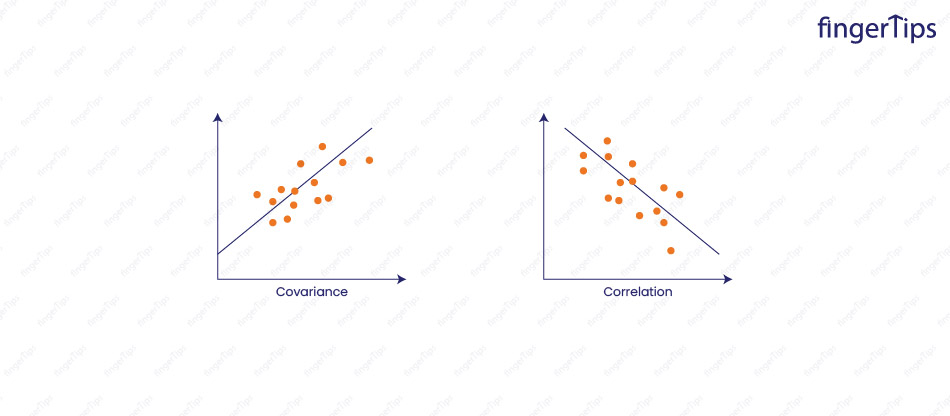
15. What are correlation and covariance in statistics?
Correlation is a measure of the strength and direction of the linear relationship between two variables. It ranges from -1 to 1, where -1 indicates a strong negative relationship (as one variable increases, the other decreases), 0 indicates no relationship, and 1 indicates a strong positive relationship (as one variable increases, the other also increases).
Covariance is a measure of the joint variability of two variables. It is calculated as the average of the product of the deviations of the two variables from their means. Like correlation, it can range from -infinity to infinity, but it is not standardized and does not have a fixed meaning for its values.
16. What is multicollinearity and how can it be addressed?
Multicollinearity is a condition in which two or more predictor variables in a multiple regression model are highly correlated. This can cause unstable and inconsistent coefficient estimates, and make it difficult to interpret the results. Multicollinearity can be addressed by removing one of the correlated predictor variables or by using a different statistical model.
17. How would you define Kurtosis?
Kurtosis is the measure of the flatness of a distribution. It is a measure of the tail of the distribution and indicates how much of the data is concentrated in the tails relative to the normal distribution.
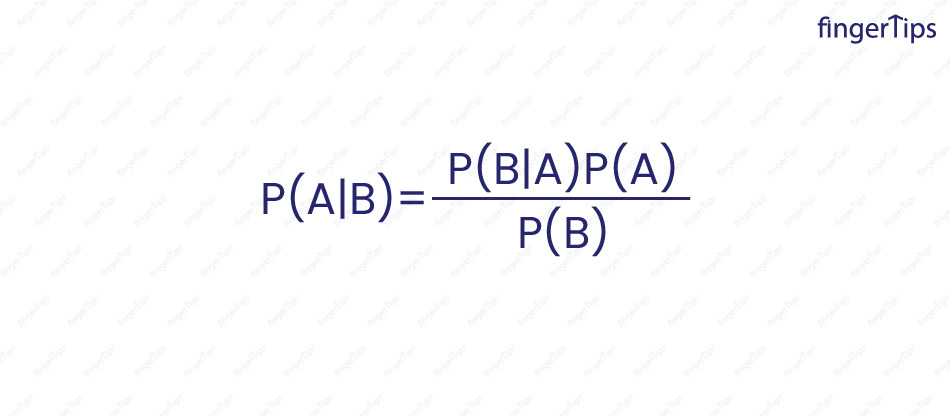
18. What is Baye's theorem and how it is used?
Baye's theorem is a way of calculating the probability of an event based on prior knowledge of conditions that might be related to the event.
It can be written as:
P(A|B) = (P(B|A) * P(A)) / P(B)
It is used to update the probability of an event based on new evidence.
19. What is the meaning of degrees of freedom in statistics?
Degrees of freedom are the number of independent pieces of information that are used to estimate a population parameter. It is used to determine the precision of an estimate and the reliability of statistical tests.
20. What is the meaning of sensitivity in statistics?
Sensitivity is the number of true positive cases divided by the total number of positive cases. For example, if a medical test has a sensitivity of 90%, this means that it correctly identifies 90% of the people who have the disease (true positive cases) out of all the people who have the disease (positive cases).
Want to Become a Data Scientist? Enroll in Data Science Master Program! Click To Know more
Intermediate Statistics Interview Questions
1. What is the difference between Probability and Likelihood?
Probability attaches to possible results and is a measure of the likelihood of an event occurring, while likelihood attaches to hypotheses and is a measure of the probability of an event or outcome given certain evidence or observations.
2. How do you choose an appropriate sample size for a study?
The appropriate sample size for a study depends on the size of the population, the desired level of precision, and the expected effect size. A larger sample size is generally needed for a more precise estimate or for a smaller expected effect size.
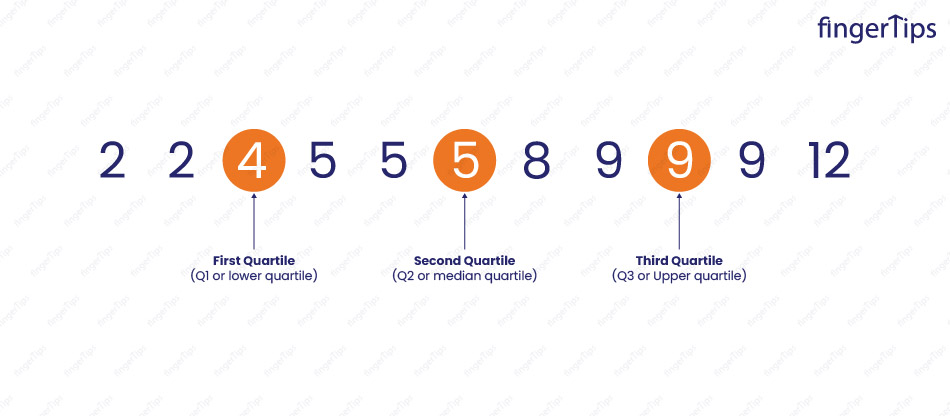
3. What is the difference between the first, second, and third quartiles?
The first, second, and third quartiles are values that divide a distribution into four equal parts (or quarters).
- The first quartile, known as the 25th percentile, is the value that separates the lowest 25% of the data from the highest 75% of the data.
- The second quartile, known as the median or the 50th percentile, is the value that separates the lowest 50% of the data from the highest 50% of the data
- The third quartile, known as the 75th percentile, is the value that separates the lowest 75% of the data from the highest 25% of the data.
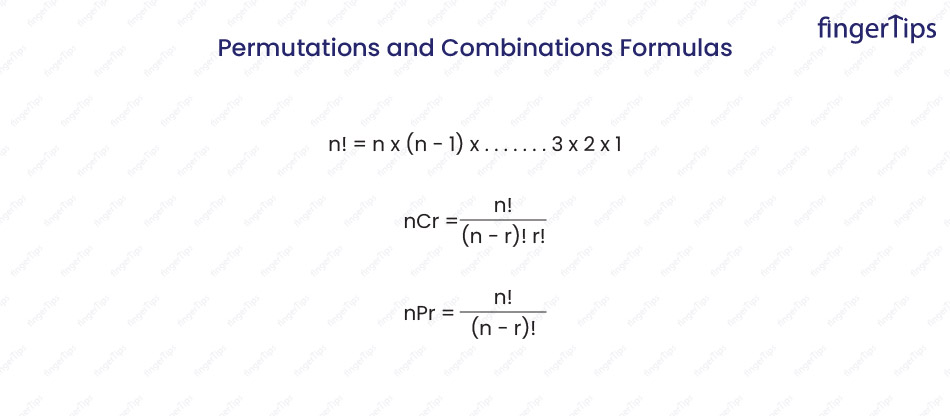
4. What is the difference between a combination and a permutation?
A combination is a selection of items from a group, where the order of the items does not matter. The number of combinations of n items taken k at a time is given by the binomial coefficient:
n! / (k! (n-k)!)
A permutation is a selection of items from a group, where the order of the items does matter.
The number of permutations of n items taken k at a time is given by:
n! / (n-k)!
5. What are observational and experimental data in statistics?
Observational data is collected by observing the subjects of the study, without manipulating or intervening in any way. It is often collected using methods such as surveys, questionnaires, and observations.
Experimental data is collected by manipulating one or more variables and observing the effect on the subjects of the study. It is collected using methods such as controlled experiments and randomized controlled trials.
6. What are outliers and how to detect them?
Outliers in a data set are significantly different from the majority of the other observations.
There are several ways to detect outliers in a data set:
- Visual inspection
- Z-score
- Interquartile range (IQR)
- Extreme value analysis
7. What is the impact of outliers in statistics?
Outliers can have a significant impact on statistical analysis, as they can affect the results of statistical tests and the interpretation of the data.
There are some ways in which outliers can impact statistics:
- Skew the results
- Affect the variability of the data
- Impact the accuracy of predictions
- Misleading conclusions
8. What are some of the properties of a normal distribution?
Some of the properties of a normal distribution:
Symmetry: It is symmetrical around its mean, with half of the observations on either side of the mean.
Unimodality: It has a single peak.
Asymptotic: It approaches but never touches the horizontal axis as the values become infinitely large or small.
Continuous: It is defined at all points on the real number line.
68-95-99.7 rule: Approximately 68% of the observations fall within one standard deviation of the mean, 95% fall within two standard deviations, and 99.7% fall within three standard deviations.
Bell-shaped curve: Most of the observations are concentrated in the middle and fewer observations as we move further from the mean.
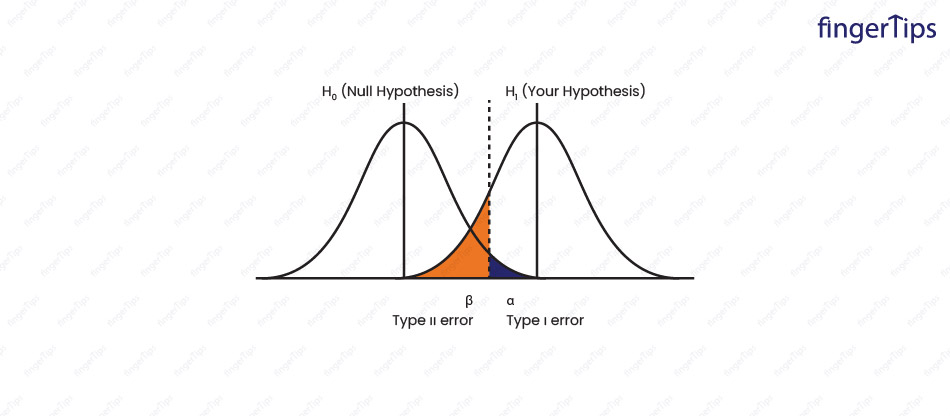
9. What is the difference between type 1 error and type 2 error?
In statistical hypothesis testing, a type I error is the rejection of a true null hypothesis (also known as a "false positive" finding), while a type II error is the failure to reject a false null hypothesis (also known as a "false negative" finding).
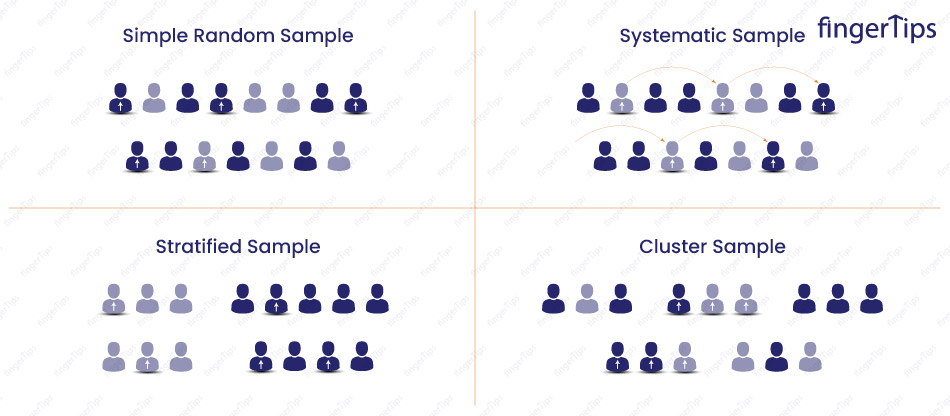
10. What is sampling and what are the types of sampling in Statistics?
Sampling is the process of selecting a subset of observations from a larger population, to make inferences about the population based on the sample.
There are several types of sampling techniques, including:
Simple random sampling: Each member of the population has an equal probability of being selected for the sample.
Stratified sampling: This method involves dividing the population into strata (subgroups) based on some characteristic, and then selecting a random sample from each stratum.
Cluster sampling: This method involves dividing the population into clusters (groups), and then selecting a random sample of clusters. All members of the selected clusters are included in the sample.
Systematic sampling: Every nth member of the population for the sample, where n is the sample size divided by the population size.
11. What is the difference between one-tail and two-tail hypothesis testing?
A one-tailed test is a hypothesis test in which the alternative hypothesis specifies the direction of the effect. For example, if the null hypothesis is that the mean of a population is equal to some value, the alternative hypothesis might be that the mean is greater than that value, or less than that value.
A two-tailed test is a hypothesis test in which the alternative hypothesis does not specify the direction of the effect. In this case, the alternative hypothesis might be that the mean of the population is different from the specified value, without specifying whether it is greater or less than that value.
12. What is hypothesis testing and the steps involved in it?
Hypothesis testing is a statistical procedure used to evaluate the evidence for a hypothesis about a population parameter.
The steps involved in hypothesis testing are:
- State the null and alternative hypotheses
- Choose the significance level
- Collect the data
- Calculate the test statistic
- Determine the p-value
- Make a decision (reject or fail to reject the null hypothesis)
- Interpret the results
- Top of Form
13. What is meant by mean imputation for missing data?
Mean imputation is a method of handling missing data by replacing the missing values with the mean of the observed values. This is done to use the available data for statistical analysis, even though some of the data are missing.
Mean imputation is a simple and fast method of imputing missing data, but it can introduce bias into the results if the missing data are not missing at random.
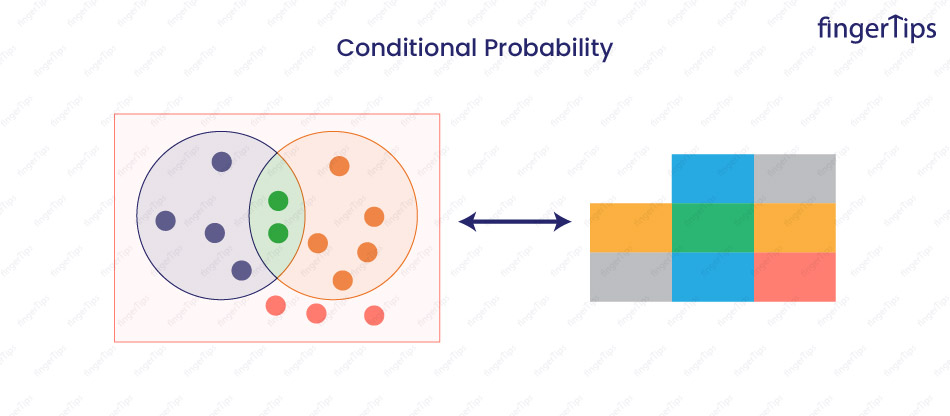
14. What is Conditional Probability?
Conditional probability is the probability of an event occurring, given that another event has occurred. It is denoted as P(A|B).
For example, consider the probability of rolling a 6 on a die, given that roll is an even number. Event A is rolling a 6, and the event B is rolling an even number. The conditional probability of rolling a 6, given that the roll is even, is P(A|B) = 1/3 because there is only 1 favorable outcome (rolling a 6) out of the 3 possible even rolls (2, 4, and 6).
Conditional probability can be calculated using the formula: P(A|B) = P(A and B) / P(B).
15. What is a Sampling Error and how it can be reduced?
A sampling error is the difference between the sample estimate of a population parameter and the true value of the population parameter. It is a measure of the variability that occurs due to sampling and is an inherent part of statistical sampling.
There are several ways to reduce sampling error:
- Increase the sample size: As the sample size increases, the sampling error decreases. This is because it is less subject to random variation.
- Use a random sampling method: Random sampling reduces the likelihood of bias in the sample.
- Use a stratified sampling method: Stratified sampling reduces sampling error by ensuring that the sample is representative of the population in terms of the characteristics that are important for the study.
- Use a cluster sampling method: Cluster sampling can be more efficient than simple random sampling when it is not practical to sample the entire population.
16. What are the different types of Probability Distribution used in Data Science?
Many different types of probability distributions are used in data science, including:
Discrete probability distributions: Probability distributions that apply to variables that can take on only a finite or countable infinite number of values.
Examples: binomial distribution, Poisson distribution, and geometric distribution.
Continuous probability distributions: Probability distributions that apply to variables that can take on any value within a certain range.
Examples: uniform distribution, normal distribution, and exponential distribution.
Multivariate probability distributions: Probability distributions that apply to multiple variables.
Examples: multivariate normal distribution and multivariate uniform distribution.
Non-parametric probability distributions: Probability distributions that do not have fixed parameters, and are estimated from the data.
Examples: empirical distribution and the kernel density estimate.
Advanced Statistics Interview Questions
1. What is a confounding variable and how can it be controlled for in a study?
A confounding variable is a variable that is related to both the independent variable and the dependent variable in a study. It can cause a spurious association between the independent and dependent variables and must be controlled for in order to accurately interpret the results.
2. What is the relationship between the confidence level and the significance level in statistics?
Confidence level is the probability that the confidence interval contains the true population parameter.
Significance level is the complement of the confidence level, which is the probability of rejecting the null hypothesis when it is true.
For example, if we set the confidence level at 95%, this means that you are 95% confident that the confidence interval contains the true population parameter. The corresponding significance level would be 5%. If we set the significance level at 5%, this means that there is a 5% chance of rejecting the null hypothesis when it is true. The corresponding confidence level would be 95%.
The confidence level is chosen before the test is conducted, while the significance level is determined during the hypothesis testing process.
3. How are confidence tests and hypothesis tests similar? How are they different?
Similarities:
Confidence tests and hypothesis tests are similar in that they are both used to estimate the properties of a population from a sample.
They both involve constructing a confidence interval or a hypothesis test statistic and comparing it to some pre-determined threshold to decide about the population
Differences:
Confidence tests are used to estimate population parameters, while hypothesis tests are used to test hypotheses about population parameters.
Confidence tests do not involve a null hypothesis or alternative hypothesis, while hypothesis tests do.
Confidence tests do not involve a significance level or p-value, while hypothesis tests do.
Confidence tests are generally more accurate than hypothesis tests because they provide a range of possible values for the population parameter rather than just a binary decision. However, they are also generally more conservative (i.e., they are less likely to reject the null hypothesis when it is false).
4. What is the power of a test? What are two ways to increase the power of a test?
The power of a statistical test is the probability that the test will reject the null hypothesis when it is false. In other words, it is the probability of correctly detecting an effect or difference in the population when it exists.
There are two main ways to increase the power of a statistical test:
Increase the sample size: Increasing the sample size can increase the power of a test because it reduces the variability of the sample estimates, which makes it more likely to detect a true effect or difference.
Decrease the significance level: Decreasing the significance level (i.e., the p-value threshold) makes it more likely that the test will reject the null hypothesis, which increases the power of the test. However, this also increases the chance of a type I error (i.e., falsely rejecting the null hypothesis).
5. How do you assess the statistical significance of an insight?
To assess the statistical significance of insight, we conduct a statistical hypothesis test. This involves stating a null hypothesis (i.e., the default assumption that there is no effect or difference) and an alternative hypothesis (i.e., the hypothesis that there is an effect or difference), and then collecting data and using statistical techniques to determine the likelihood of the null hypothesis being true.
If the p-value (the probability of obtaining the observed results or more extreme results if the null hypothesis is true) is below a predetermined threshold (the significance level), then the null hypothesis is rejected in favor of the alternative hypothesis. This means that the effect or difference is statistically significant, and is unlikely to have occurred by chance.
6. Can you explain the difference between parametric and non-parametric tests?
Parametric tests make assumptions about the underlying population distribution, such as that the data is normally distributed.
Non-parametric tests do not make these assumptions and can be used with data that is not normally distributed.
7. Can you explain what an ANOVA is and when it is used?
ANOVA (analysis of variance) is a statistical method used to compare the means of two or more groups. It is used to determine whether there is a significant difference between the group means.
8. What is a chi-square test and when is it used?
A chi-square test is a statistical test used to compare observed frequencies to expected frequencies in a categorical data set. It is used to determine whether there is a significant difference between the observed and expected frequencies.
9. When should you use a t-test vs a z-test?
A t-test is used to test hypotheses about the mean of a population when the standard deviation of the population is not known and the sample size is small (n < 30).
A z-test is used to test hypotheses about the mean of a population when the standard deviation of the population is known and the sample size is large (n > 30).
The true standard deviation of a population is rarely known, so t-tests are more commonly used. However, if you have a very large sample size and can assume that the sample standard deviation is a good estimate of the population standard deviation, then you can use a z-test instead.
10. When creating a statistical model, how do we detect overfitting?
Several techniques can be used to reduce underfitting and overfitting during model training:
Use a separate validation set: Use a separate validation set to evaluate the model's performance. If the performance on the training set is significantly better than the performance on the validation set, then this may indicate overfitting.
Use cross-validation: Dividing data into multiple folds and training the model across all the folds to get a more accurate estimate of its generalization error.
Plot learning curves: Plotting the performance of the model on the training set and the validation set as a function of the number of training examples can help diagnose overfitting
11. What are some of the techniques to reduce underfitting and overfitting during model training?
There are several techniques that can be used to reduce underfitting and overfitting during model training:
Increase the complexity of the model: Adding more parameters or increasing the capacity of the model can help reduce underfitting, but can also lead to overfitting if not done carefully.
Use regularization: Regularization is a technique that imposes constraints on the model parameters to prevent overfitting. There are several types of regularization, including L1 regularization, L2 regularization, and dropout.
Early stopping: Early stopping involves monitoring the performance of the model on a separate validation set during training, and stopping the training process when the performance on the validation set begins to degrade. This can help prevent overfitting.
Use cross-validation: Cross-validation involves dividing the data into multiple folds and training the model on different subsets of the data. This can help prevent overfitting by giving the model a chance to "see" more of the data.
Use a simpler model: Using a simpler model with fewer parameters can help reduce the risk of overfitting, but may also result in underfitting if the model is too simple.
12. What is the Central Limit Theorem? And what general conditions must be satisfied for this theorem to hold?
The Central Limit Theorem is a statistical theorem that states, for large sample size, the distribution of the sample mean will be approximately normal, regardless of the shape of the distribution of the population from which the sample is drawn.
The general conditions that must be satisfied for the Central Limit Theorem to hold are:
The sample must be drawn from a population with a finite mean and variance.
The sample size must be sufficiently large. A sample size of 30 or more is considered sufficient.
The sampling must be done independently and with replacement.
13. What is the bias-variance tradeoff and in what ways to address it?
The bias-variance tradeoff refers to the trade-off between the model's ability to fit the training data well (low bias) and its ability to generalize to new data (low variance).
A model with high bias is said to be under-fitted and will perform poorly on both the training data and new data. A model with high variance is said to be over-fitted and will perform well on the training data but poorly on new data.
Finding the right balance between bias and variance is important because a model with too much bias will be unable to capture the underlying pattern in the data, while a model with too much variance will be too sensitive to the noise in the training data and will not generalize well.
There are several ways to address the bias-variance tradeoff, including increasing the complexity of the model, using regularization techniques, and collecting more data. The choice of technique will depend on the specific characteristics of the data and the requirements of the application.
14. What are the different types of Correlation?
There are several types of correlation, including:
Positive correlation: When two variables are positively related, means as one variable increases, the other variable also increases.
Negative correlation: When two variables are negatively related, means as one variable increases, the other variable decreases.
No correlation: When there is no relationship between two variables.
Linear correlation: When the relationship between two variables can be described by a straight line.
Nonlinear correlation: When the relationship between two variables cannot be described by a straight line.
Scenario-Based Questions:
1. If 100 students fall randomly into four equal-sized classes, all partitions are equally likely. Jack and Jill are two randomly selected students. What is the probability that they both are in the same class?
For this, I will assign a different number to all the students from 1 to 100 for each student with numbers 1 to 25 in class one, numbers 26 to 50 in class two, numbers 51 to 75 in class three, and 76 to 100 in class four. Next, I would assign a random number to Jack and Jill. Once Jill has a number, 99 random numbers are remaining with 24 students which will result in Jack being part of the same class as Jill.
So, the probability they belong to same class is 24/99."
2. You are a statistician working for a dating app and are asked to predict the likelihood that a user will find a match on the app based on their profile. How would you go about finding this information?
I would gather data on the genders and locations of those
users who found matches on the app and use the formula for probability to
calculate the probability of a user finding a match based on their gender and
location.
3. Suppose there are some missing values in the dataset spread along one standard deviation from the median. Approximately what percentage of data would remain unaffected and why?
If the missing values are spread along 1 standard deviation from the median, then approximately 32% of the data would remain unaffected. This is because, in a normal distribution, approximately 68% of the data falls within 1 standard deviation of the median on each side of the median. If the missing values are spread over this range, then approximately 68% of the data on each side of the median will be affected, for a total of approximately 32% of the data that will not be affected.
If the data does not follow a normal distribution, the percentage of data that will remain unaffected will depend on the specific distribution of the data. Without more information about the distribution of the data, it is not possible to accurately estimate the percentage of data that will remain unaffected.
4. How many cards would you expect to draw from a standard deck of cards before seeing your first queen?
There are 52 cards in a standard deck, and 4 of them are queens, so the probability of drawing a queen on any given draw is 4/52 = 1/13.
So, on average, we expect to draw 13 cards before seeing the first queen.
However, this is just the average and it is possible to see a queen on the first draw, or it could take more than 13 draws to see the first queen.
Suppose you are a data scientist in a retail company and are
asked to calculate the correlation between the price of a product and the
number of units sold. How would you do that?
I would gather data on the prices and sales of a sample of products and use statistical techniques such as Pearson's correlation coefficient to measure the strength and direction of the relationship between the two variables.
Conclusion
In this blog, we tried to simplify the process of understanding the statistical importance in the data science career. Hope this information will enhance your statistical concepts. These Statistics interview questions covers the basic, moderate and advance level statistic questions along with scenario-based questionnaire that helps and make it easier for the students and professionals to illuminate their fundamentals principles on statistics.