
Complete Guide On Tools Used By Data Analysts In The Business
As you already know, every other individual is producing huge lots of data by performing their day-to-day. But, do you know, this data is of utmost importance for the businesses to take necessary actions in their strategy? The data that is produced is in raw form and cannot be used directly by the brands. Therefore, data analysts perform tons of processes on this data to extract insights from it. So, the process of converting the raw data into actionable insights requires analytical tools. In the blog, not only we'll see data analytics tools but also how to select these analytical tools.
What Is Data Analysis? How To Select Data Analysis Tools
As mentioned earlier, data analysis is the process of working with raw data to extract insight from it, that later can be used to make informed decisions. This process is performed by data analysts using a data analytics tool. Also, do you know, there are tons of data analyst tools, and it is very essential to pick the right tool for your organization's work?
The first step while selecting the perfect tool is to identify the business problem and business requirement and then find out who is going to work on the data with the help of tools. The second step is to identify the properties and capabilities of these tools. Which tool is capable of performing which task and with which efficiency? At last, consider the prices of these tools.
The decision maker should keep in mind that the most expensive tool doesn't need to be the best one. Now, that it's clear how to select the tool, let's see the top tools for data analysis.
Top Tools Used By Data Analysts
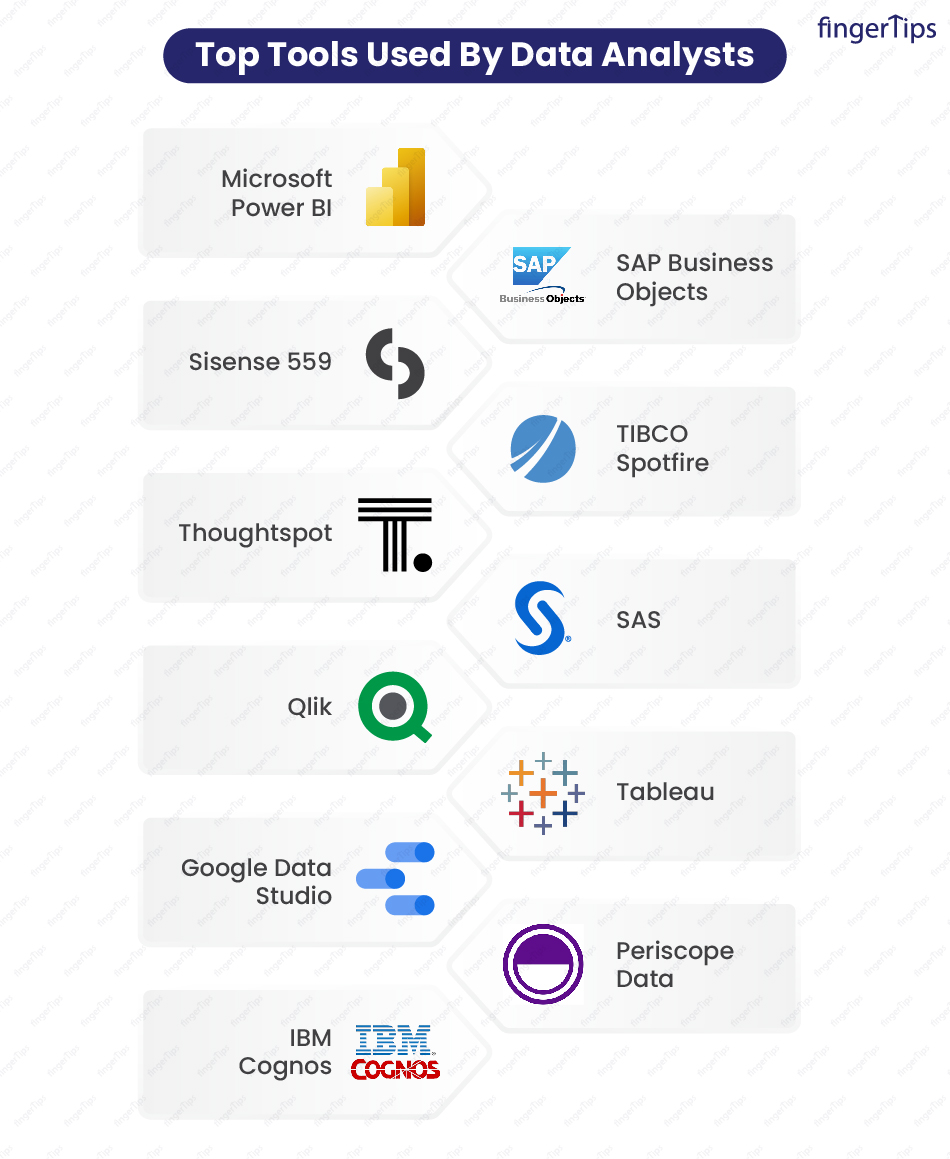
Below mentioned are some of the must-haves as well as the popular and useful data analysis tools. Whether you're already a data analysts or an aspiring one, this part of the blog will be very informative and useful for you. Let's see the top tools for data analytics.
Microsoft Power BI
The first in line is Microsoft PowerBI. The tool is a business intelligence tool majorly used by non-technical users to work with data and present the data. The most important feature of the Power BI tool is that its working is very much similar to Mircosoft Excel, which helps the user to navigate the platform much easier. This tool by Microsoft is highly affordable, it's desktop version comes at free cost. Not only this, PowerBI provides the option to save your data in Excel format. Lastly, the tool comes with regular updates for data visualization.
This was about one of the data analyst tools, let's see about another one.
SAP Business Objects
SAP business object is a BI tool that is used for data mining, analyzing, and reporting purposes. The tool is capable of handling complex data along with being easily used by non-technical peers. The tool can analyze each bit of data and identify the hidden patterns and trends in the same. This identification helps the business to grab opportunities at an early stage and get additional benefits. Also, the tool is available as a mobile version where you can easily track and get updates on your current projects.
Sisense 559
Sisense is an AI-based business intelligence data analysis software that is used by experienced individuals to make sense of complex huge data. The data is converted into visualization and is used for important decision-making processes. The feature and capability of connecting with multiple dashboards make it one of the most used data analysis tools. Users can create dashboards, share them, export them in multiple formats, and perform analysis on the same. Apart from these features, there's an option of using Sisense mobile that will let you operate your dashboards on the way.
TIBCO Spotfire
TIBCO Spotfire is one of the data analysis software used in business and in organizations to create a visualization that'll help them to make decisions for the future. The tool is capable of working with tons of data at a good speed and is used across multiple fields of business like healthcare, retail, finance, manufacturing, and more. The tool is a little expensive for small businesses and therefore, big businesses have great benefits from this tool. Though the tool offers the option of customization, users often complain of having multiple buttons and tabs that are difficult to operate.
Unlock Your Potential As A Data Analyst, Join Our Data Science Masters Course
Thoughtspot
ThoughtSpot is an emerging analytics platform that enables users to locate data and benefit from the most cutting-edge developments in the cloud data ecosystem by using NLP search and artificial intelligence. The tool claims that companies can automate all business operations, spread the value of their data to partners and customers, and educate all individuals with the power of their modern data stack. Users can enter their queries into ThoughtSpot's Structural Search Tool in the same manner they would on another search engine. Based on the outcomes, it creates a data visualization model in a matter of seconds. This saves up the time of professionals.
SAS
The full form of SAS is a statistical analysis system and is BI and one of the data analysis tools. The important features that the tool provides its user are data mining, modeling, framing reports, etc. The price of this particular tool is a little on the high side of the range but it also has good benefits compared to the high price. In the huge pool of data, SAS helps professionals to identify relations, trends, and patterns effortlessly. Along with that, users can create reports and visually appealing dashboards with no or little technical requirements.
Qlik
A self-service BI and data analytics platform from Qlik enables both on-premises and cloud implementation. Both technical and non-technical people can easily explore and discover data with the program. Users using Qlik can alter a wide variety of charts using drag-and-drop and built-in SQL modules. The tool has multiple benefits like making visualizations and dashboards from social media data, analyzing sales data, and much more.
Tableau
If you've even a little bit of knowledge of the technical topics, chances are you've already heard the name of this most common tool which is Tableau. Tableau is without a doubt a leading tool used by professionals for data visualization purposes. Products of this tool come in a variety of versions like Tableau desktop, Tableau online, Tableau server, Tableau leaders, etc. The tool comes with drag and drop feature which makes the tool very easy to use even for beginners. Also, the plus point is that the Tableau public version of this tool is freely available to use.
Google Data Studio
A web-based application for data visualization called Google Data Studio enables users to create personalized dashboards and clear reports. It aids in visualizing patterns, comparing achievements over time, and measuring important KPIs for clients. Data Studio is excellent for individuals who need to analyze their Google data because it integrates with other services offered by Google. For instance, for better comprehension of client conversion and retention, advertisers can create displays for their Google Ads and Analysis data.
Periscope Data
A BI and data analytics tool for contemporary businesses is called Periscope Data. You may integrate data from many sources using the program, which also provides the capabilities for analysis and the creation of the appropriate visualizations to communicate with your team. Periscope takes pride in being easy to adopt so your company can start producing reports and data visualizations right away. With Periscope, you may combine many data sources for analysis in SQL, Python, and R. Different levels of user access will enable everyone in your company to make data-driven decisions.
IBM Cognos
The last tool that we'll see in the list of various analytical tools is IBM Cognos. This is an AI-based tool that has various automated feature that makes it different from other tools. IBM can automatically clean and work with data which makes the analysis process quick and faster. Professionals can easily convert textual long data into multiple dashboards and visualizations and later can convert the reports in multiple formats like pdf, excel files, etc. The tool is feasible for medium-sized as well as for large businesses.
This brings us to the end of this guide. Let's continue to conclude the blog.
Conclusion
For you to know the necessary to select the multiple tools that would best suit your analytical procedures, we have outlined what data analyst tools are and provided a brief overview of each. By this point, we anticipate that you have a better understanding of how cutting-edge technologies might assist analysts in carrying out their tasks more successfully in a setting that is less prone to error.