

Step-by-Step Guide to Export Power BI Data to Excel

Overview
Microsoft’s Power BI makes sure that you design data models and then convert them into, interactive reports that reach the right audience.
It has been studied that financial professionals use Power BI profoundly, but still it is essential that static report generation in Excel is also necessary to analyze the data. So let us know how we export the Power BI data to Excel:
It's an easy and interesting process to export data from Power BI to Excel! Normally, data is imported from Excel to Power BI. Overall, it is quite a simple and to-the-point process. This Blog will give you a step by step guidance on exporting Power BI data to Excel. Let's understand the basic concept so it will be easy for you to follow the further steps as we proceed.
What is Power BI?
Microsoft Power BI is a business analytics tool that allows you to view data and share insights. It converts data from various sources to generate interactive dashboards and Business Intelligence reports and visuals.
Power BI Desktop is used to make reports, and visual representations pf data. Power BI Services (Software as a Service – SaaS) is used to publish the reports, and Power BI Mobile is used for reports and dashboard outlook.
What is Excel?
Excel enhances the data and gives details on the data structure in the form of charts, graphs, and visual reports with the best use of the data formatting and table structures it easily portrays the importance of the extracted data.
Excel helps in data analysis. The spreadsheets in excel organize the data by computation and various formulae that helps to solve tedious numerical problems.
How you can export the PowerBI data to Excel?
- Go to app.powerbi.com and select a report to which you have permission to access.
- Click the “…” button in the top right of the selected graphic, then the “Export data” button.
- Select if you want to download a CSV or XLSX file with the visual data.
- By default, you will only have access to the data sorted by the “Summarized data” view; you van export the unfiltered data by selecting “Underlying data.”

Just go ahead and update your data or re-generate graphs or charts in Excel. This first form of Power BI export to Excel is to the point but has the following limitations.
Data from one visual can only be exported in a new CSV in one go. There is access to export data connected with a Power BI visual; you cannot extract a table as the data and model are not detectable in the published report.
The Power BI report does not allow the data in Excel to get updated. You can export a table from Power BI to Excel by selecting a table in the “Data” view, then right-clicking and selecting “Copy” for a column or “Copy Table” for the full table. To work on the data, just paste it into an Excel file.
How will you export the data sets from Power BI to Excel?
Another method for exporting data from Power BI to Excel can manage entire data sets and the add-on factor is that the data can be directly refreshed in Excel.
This will be useful for exporting vast data volumes.
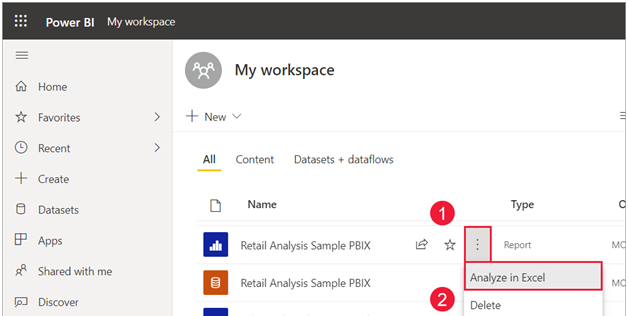
Understand the process of how you can use the “Analyze in Excel” feature to link your data set to a blank Excel file:
1. Visit app.powerbi.com.
2. Open the report containing the data set you willing to export.
3. To the extreme right of the ribbon above the report, click “…”
4. Select “Analyze in Excel.”
This will download an Excel file in the.ODC (Office Data Connection: an extension contained in HTML and XML) format. From here, you can instantly construct PivotTables, visualizations, and so on in Excel using the data obtained from the Power BI data cube.
This is another form of Power BI export to Excel also has certain limitations but has the benefit of holding semi-dynamic features. It creates a new file with an unknown extension (.ODC, while Microsoft recommends using the .XLSX extension). Measurements from data sets must be produced beforehand as Pivot Table does not make them.
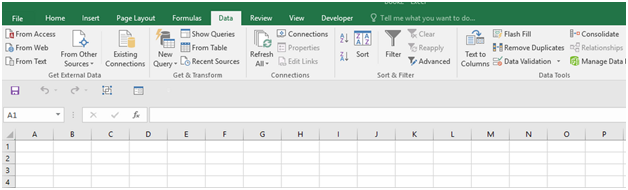
Explain the “Get Data” in the Excel
- Check out how you can use Excel to access Power BI data:
- Click “Get Data.” from the Excel “Data” tab,
- Select “From Power BI.” from the drop-down option,
- Select a dataset from the right-hand panel, to build a Pivot Table in Excel.
- To show, select fields from the PivotTable Field List.
This is a quick and simple method for exporting data from Power BI to Excel
This is because selecting fields from a PivotTable Field List possibly can make it difficult to get the data set, specifically if you did not generate the the Power BI dashboard. To generate your desired table may be a time consuming task as you have to click on various Pivot Table columns in Excel.
What is the best approach to export Power BI to Excel?
1. Exporting data from a Power BI visual is the good option when you just want to get the data within a Power BI graphic.
2. Analyze with Excel – this is a better option if you want to have a track on your Power BI datasets. You get extra perks by importing the entire dataset, as long as your measurements are generated well before time so that it can be used in the tables and graphs accordingly.
3. Get Data from Within Excel – This is the most convenient method of exporting Power BI data to Excel. However, if you did not develop the Power BI dashboard, picking the appropriate PivotTable columns can be time consuming.
What are the benefits of Power BI?
- Power BI processes data fast than Excel.
- Dashboards in Power BI are more appealing and attractive, interactive, and configurable than those in Excel.
- When it comes to comparing tables, reports, or data files, Power BI adds on more value as compared to Excel.
- Users find Power BI is more comfortable and precise than Excel.
Conclusion
This article covered the three different methods for exporting data from Power BI along with its basic advantages:
First method is when you export data from the Power BI dashboard.
Second method explains data export from Power BI reports.
Third method explains, when you want to export data from Power BI applying copy and paste data in most simple and convenient way.