

What Are the Advantages and Disadvantages of Power BI Tool

Business intelligence, business analysis, data science, machine learning, and artificial intelligence will continue to be hot topics in 2023. Every business, from small to large scale, aims to extract meaningful insights from data. One tool that helps professionals manage and work with data is Power BI. In this blog, we'll be seeing the pros and cons of Power BI. Before jumping straight to the topic, let's first see what Power BI is.
What Is Power BI?
Power BI is a business intelligence tool provided by Microsoft that helps professionals manipulate the data and later visualize the data for better understanding. Power BI comes with in-built tools to analyze and visualize the data and frame interactive dashboards and reports from it. As with every other tool comes the Power BI pros and cons. Let's see what those are.
Pros Of Power BI
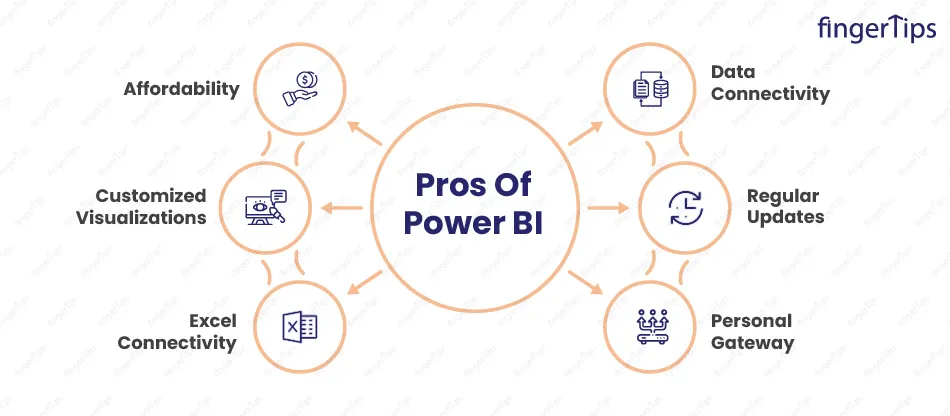
As Power BI is the most preferred tool for business analysts, there are various advantages of Power BI. Let's see what those Power BI pros are.
Affordability
Users of Power BI may share, collaborate on, and create interactive data visualizations for a reasonable subscription cost. Numerous capabilities, including data connectors, dashboards, and real-time updates, are included in the Pro edition. Power BI promotes data-driven decision-making by enabling customers to employ powerful analytics and business intelligence tools without the financial burden of significant fees, increasing organizational efficiency and productivity.
Customized Visualizations
The ability to create custom visualizations with Power BI is a key advantage distinguishing it from other business intelligence products. Businesses can show data in distinctive and customized ways, facilitating better comprehension and decision-making by enabling users to build and integrate custom visualizations. The ability to create interactive charts, graphs, and maps that precisely match their unique requirements and branding encourages creativity and flexibility in users. As a result, organizations can better engage stakeholders with visually appealing and insightful data representations, resulting in better insights and outcomes.
Excel Connectivity
One key benefit that improves Power BI's usability and effectiveness is its seamless interaction with Excel. Users can easily import spreadsheets into Power BI for analysis and visualization using their pre-existing Excel abilities and data models. The seamless shift from static Excel reports to dynamic, interactive dashboards with real-time data updates is made possible by this interface.
Power BI gives customers the tools they need to examine data trends, correlations, and insights more by bridging the gap between conventional spreadsheet research and sophisticated business intelligence. Organizations can make data-driven decisions quickly and confidently because of familiarity and ease that reduce learning curves and save time.
Data Connectivity
The powerful data connectivity capabilities of Power BI are a distinguishing feature that enhances its standing as a top-tier business intelligence solution. Power BI can easily access and combine data from various sources, including databases, cloud services, web platforms, and on-premises applications, thanks to a wide selection of data connectors. Users are given the ability to combine and analyze data from several channels, enabling a full perspective of their business operations. Power BI's data connectivity means that organizations may gain valuable insights from various sources, whether the data is structured or unstructured, making it a flexible and essential tool for data-driven decision-making.
Regular Updates
Power BI's prompt updates are a useful feature that keeps the data and visualizations up to date and useful. Users may obtain up-to-date information without manual intervention thanks to real-time data updates and easy connection with data sources. This guarantees that crucial information and business indicators are always correct and available. Stakeholders can stay informed without making continuous human efforts thanks to the option to schedule automatic updates and define refresh intervals. Quick updates allow organizations to react quickly to shifting market conditions, empowering them to make agile decisions based on the most recent data, increasing overall productivity, and maximizing the potential of data-driven analytics.
Personal Getaway
A personal gateway is a useful tool that enables private data access and sharing for individual users as a Power BI Pro feature. It enables seamless data refresh in Power BI while allowing users to connect to on-premises data sources, guaranteeing that data stays behind the organization's firewall. This will enable users to access and analyze current data without risking their security. Users can schedule data refreshes with a personal gateway to work with real-time data in their reports and dashboards. This feature encourages effective and safe self-service analytics by enabling users to utilize Power BI while maintaining control over their data fully.
Cons Of Power BI

Below mentioned are some of the disadvantages of Power BI.
Table Relationships
Even though Power BI's Table Relationships are crucial for building meaningful data models, novice users may find them difficult to use. Correct relationship definition and management necessitate a solid grasp of data structures, which might be intimidating for some people. Relationship mistakes can result in misleading visualizations and conclusions. Furthermore, managing complicated relationships might affect performance, resulting in longer report loading times. The right documentation and training are essential to reducing these difficulties. Despite this, Table Relationships are incredibly useful for maximizing Power BI's analytical capabilities once they are grasped.
Configuration of Visuals
Due to its complexity, Power BI's visual configuration can disadvantage some users. Users without prior data visualization skills might find the platform's many customization possibilities too much to handle. A learning curve is involved in setting up graphics to conform to certain design and formatting requirements, which could result in uneven or less-polished reports. Additionally, matching visuals across different devices or screen sizes can be difficult, which can negatively impact user experience. Power BI might benefit from enhanced user-friendly interfaces and templates that streamline the process, allowing users to quickly generate appealing and unified visualizations to overcome this drawback.
Crowded User Interface
Power BI's user interface may feel overloaded, especially when dealing with intricate reports and dashboards. The interface can be intimidating and difficult for novice users to use due to the number of features, options, and components. The crowding could result in a crowded appearance, altering how users interact with the data and how it is interpreted. Power BI might concentrate on enhancing tool organization, enabling customizable layouts, and providing simple options to conceal or collapse less-frequently used capabilities to provide a cleaner and more user-friendly interface for all users to lessen this drawback.
Rigid Formulas
Users needing sophisticated data processing and complex calculations may find Power BI's inflexible formulas a hindrance. There are several restrictions and a lack of flexibility with the DAX (Data Analysis Expressions) language used in Power BI. Writing complicated formulas can become laborious, increasing the length of the development process. Additionally, lacking support for some procedures or functions may make it difficult to meet some analytical requirements. Power BI might enhance DAX's functionality or integrate with other programming languages to alleviate this drawback, allowing customers to efficiently do more complex computations and data transformations.
Handling Large Data Volumes
An issue with Power BI is that managing massive data quantities can be difficult. Performance problems may occur as data size grows, resulting in slower report loading times and decreased responsiveness. Large datasets may also put a strain on the system's resources, leading to errors or sluggish data refreshes. To properly manage performance, users may need to optimize data models, restrict visualizations, or archive older data. Power BI might use improved data compression methods, make use of cloud-based processing, or offer more scaling options to get over this drawback and guarantee smooth performance and flawless analysis even with huge datasets.
Complex to Understand and Master
Due to its complexity, Power BI might be difficult for some users to fully comprehend and master. Beginners may become overwhelmed by the wide variety of features, data modeling ideas, and DAX language, which will result in a steep learning curve. It takes a lot of time and effort to master Power BI since it necessitates a thorough understanding of data manipulation, relationships, and report building. Power BI may offer more approachable lessons, streamlined documentation, and interactive learning opportunities to lessen this drawback. Increasing the accessibility of learning resources would enable users to fully utilize the platform and encourage broader adoption across a range of skill levels.
Conclusion
These were some of the power bi advantages and disadvantages that we saw in the blog. Power BI can assist you in gaining insightful information from your data, driving business growth, and staying one step ahead of the competition, whether you run a small startup or a large enterprise. Therefore, if you still need to delve into the world of Power BI, this is the ideal opportunity to do so and experience its trans-formative potential. With Microsoft Power BI, embrace the power of data, visualize your progress, and make better decisions.